The waters of the Sound are dense, cold and often filled with both organic and inorganic matter that reduces the visibility to a few inches in some locations. On a good day, light may only penetrate a few feet below the surface rendering most optical technologies ineffective to study the larger scale features of the seafloor. Sound waves produced by acoustic technologies, however, are able to pierce the cloudy waters to a much greater degree to collect data that produces a variety of map products.
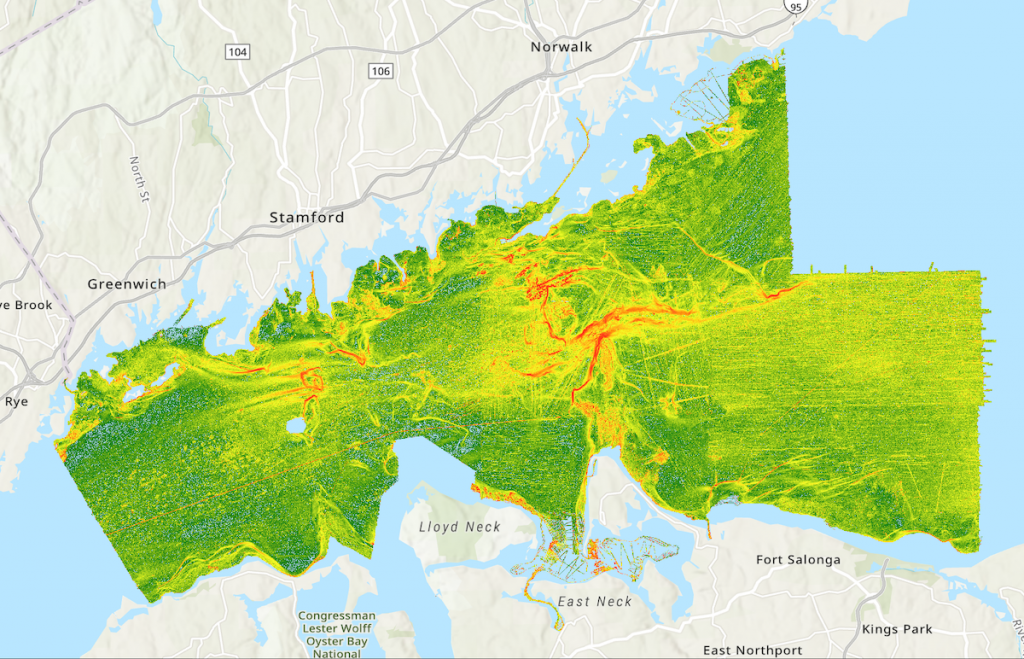
Bathymetry
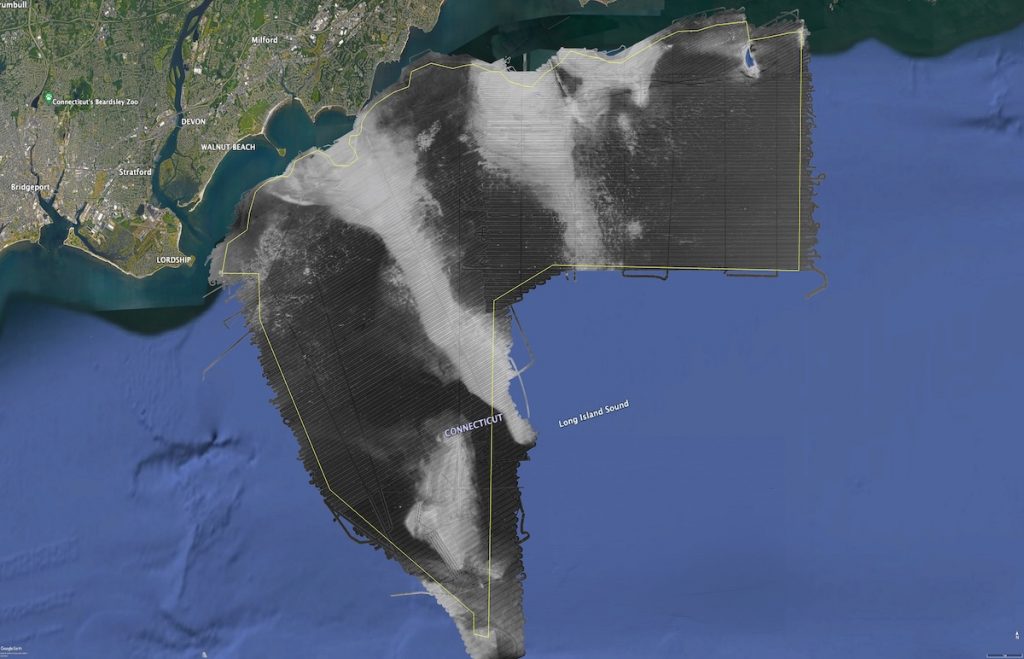
Backscatter
Acoustic products
Acoustic technologies
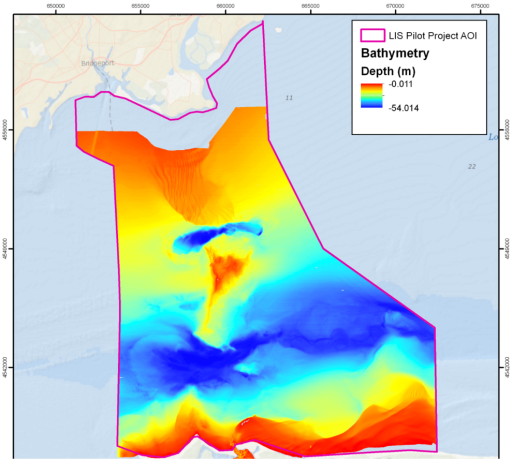
Bathymetry is the measure of the depth of the water and is typically derived from multibeam sonars. For the LIS mapping these systems were operated from ships with a transducer that produces a swath of sound that was reflected from the seafloor back to the sonar. Knowing the speed of sound in water allows the depth to be determined by the time the sound takes to travel from the ship to the seafloor and back. Bathymetric maps provide a high resolution representation of the seafloor landscape.
The LIS Seafloor Habitat Mapping Initiative teams have generated bathymetry maps for several priority regions of the Sound. These can be accessed using the Long Island Sound Data Navigator or the LDEO Long Island Sound Data Archive.
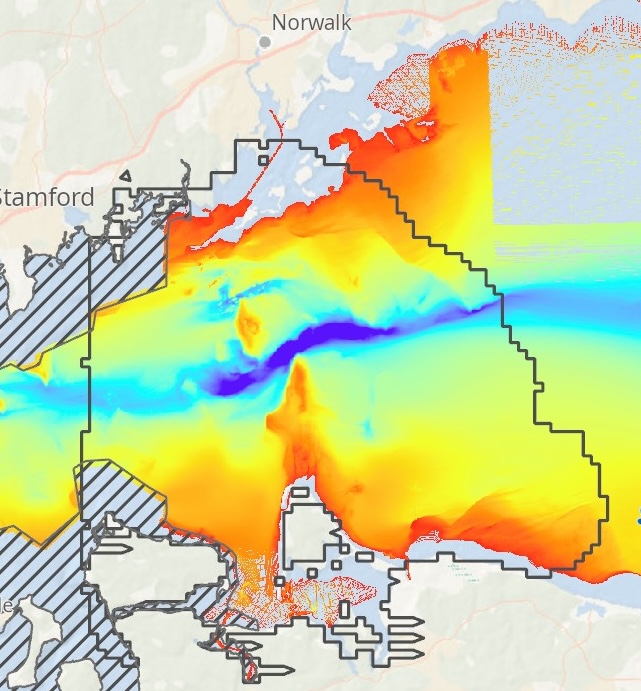
Backscatter is a measure of the strength of the return of the acoustic signals sent to the seafloor by multibeam sonar systems. A hard surface, such as boulders or gravel, reflects a lot of the sound, while a soft bottom, such as mud, absorbs a lot of the sound. The sonar interprets these varying strengths as a gray-scale image, typically showing soft areas as darker and the harder areas as lighter in these images. These backscatter mosaics, therefore, serve as a proxy for the nature of the seafloor, providing valuable information for research scientists and resource managers. The LIS Seafloor Habitat Mapping Initiative uses these backscatter maps as a foundational layer upon which additional data such as sediment grain size, species composition and physical oceanographic data to develop comprehensive, integrated habitat maps.
Backscatter maps can also be accessed using the Long Island Sound Data Navigator or the LDEO Long Island Sound Data Archive.
Acoustically Derived Products
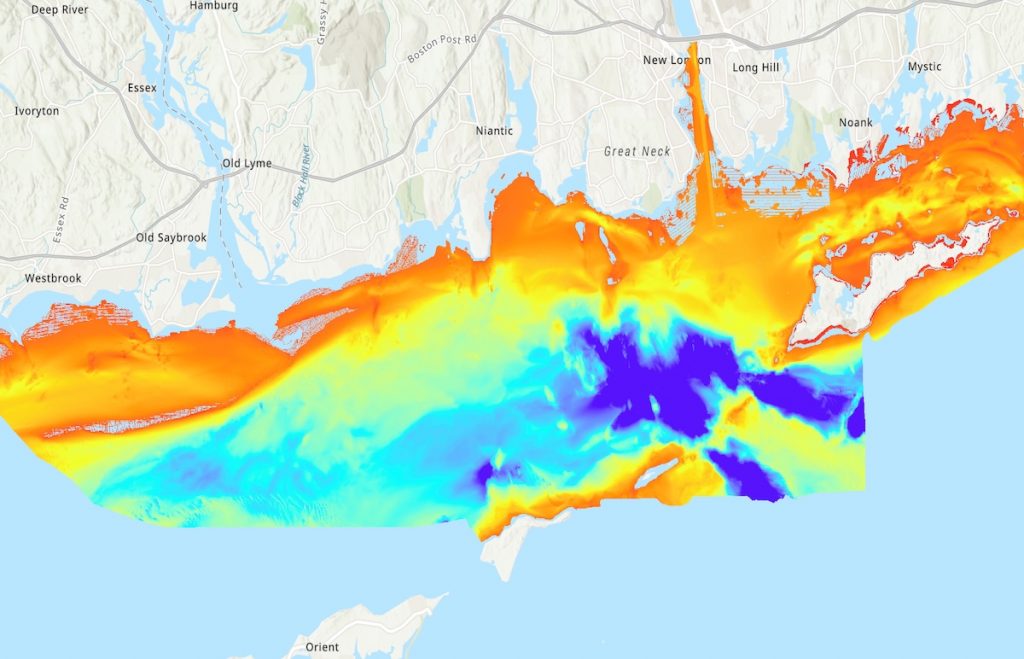
Topographic Roughness Index
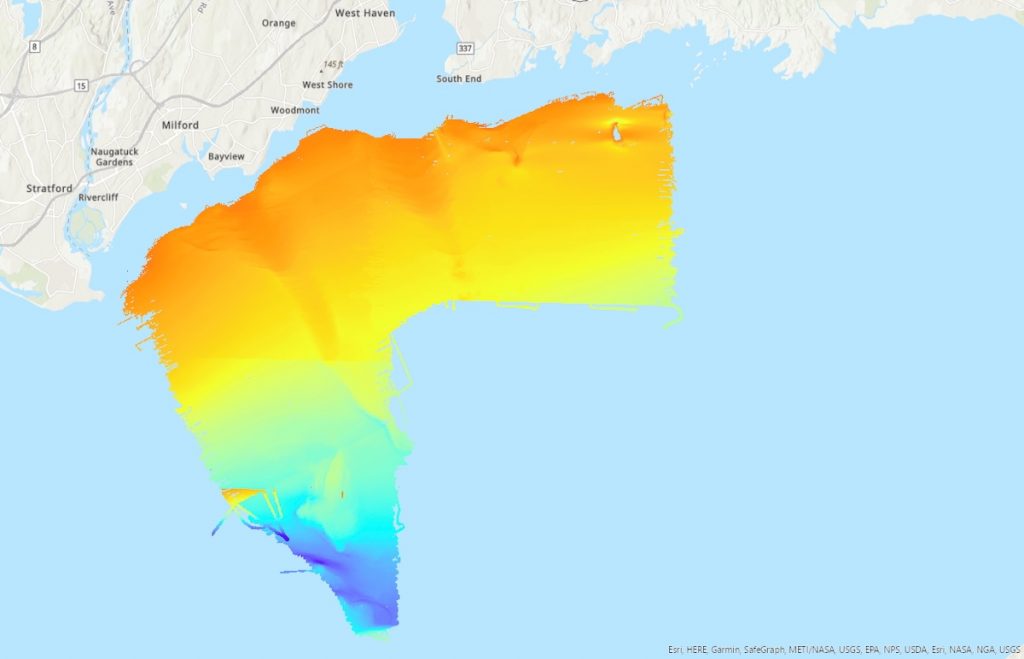
The bathymetric map is developed from thousands of data points that represent X,Y and Z space of the water, where is X=latitude, Y=longitude and Z=water depth. Researchers analyze these data to derive various ways to visualize the seafloor. One tool that provides insight into the seafloor topography and provide clues as to what the habitats might look like is the “Topographic Rougness Index (TRI). Simply put, the TRI measures how much the depth changes from one point to another and visualizes those changes. Areas with rapid changes in depth have a higher TRI value and the computer assigns a color-ramp to those values, in the map on the right red represents areas with rapid change (steep slopes), while green are areas with little change in depth. Ecologists area able in infer a great deal about what organisms inhabit these areas based upon previous studies and observations.
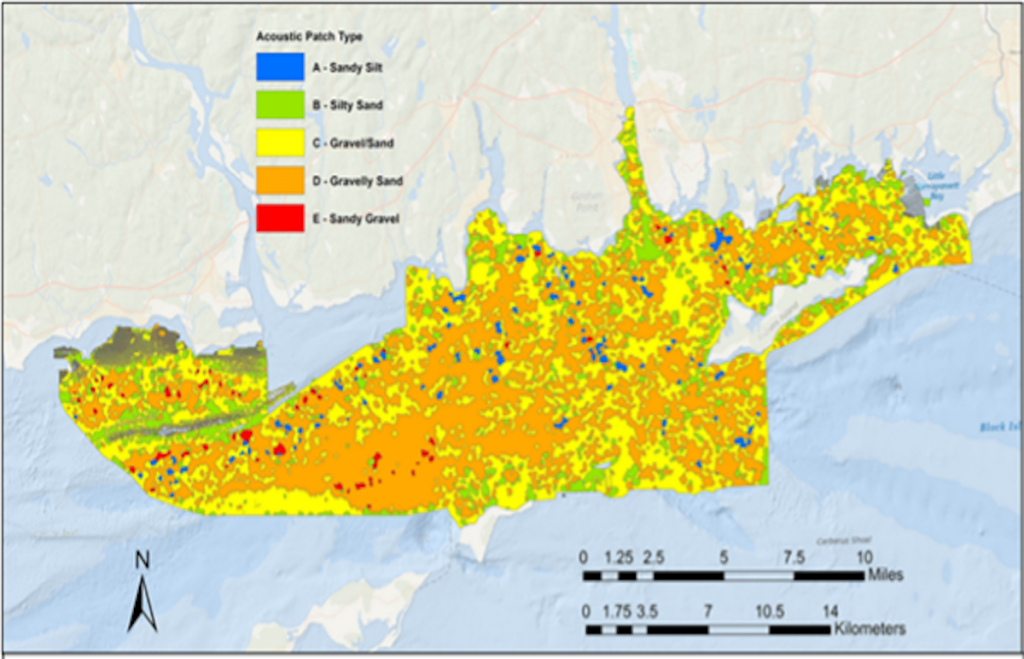
Acoustic Patch Type
The “backscatter” map depicts the strength of the reflection of the acoustic ping sent out from the sonar system on the survey vessel. The amount of sound returned depends upon the nature of the seafloor. Soft bottoms like mud absorb much of the sound and harder bottoms like gravel or boulders reflect much more sound. The mapping software assigns gray scale values to these returns, with black being lower and lighter colors higher levels of reflected sound. The backscatter image was analyzed using eCognition software that parsed the acoustic data into classes or patches based upon similarities in the return strength value. This is often an iterative process, with the patches forming the basic units of the more comprehensive Integrated Habitat Map.