The Long Island Sound Seafloor Habitat Mapping Initiative recognizes the criticality of information about the physical oceanographic environment that impacts all of the other attributes of the seafloor habitat mapping initiative. An introduction to the physical oceanographic characterization from the Long Island Sound Study’s Sound Update can be found here: Physical Oceanography.pdf
The central challenge of the Physical Environment component of the LIS Mapping Initiative is to combine existing data with new observations to create model-generated, user-friendly maps of critical variables such as seafloor temperature, salinity and bottom stress that can be used by planners, managers, and scientists. The model predictions are necessary since we can’t make measurements everywhere or hope to observe all possible conditions at a site over a short-term instrument deployment. The mathematical model is continually refined with more actual observations. The spatial and temporal structures of the temperature, salinity, and bottom stress fields captured by the model show excellent agreement with the field measurements and clearly support the model’s use as a tool to interpolate spatially between the observations for the purpose of making maps of these physical characteristics of the bottom environment that are ecologically important. Physical oceanographic data and products can be accessed through the Long Island Sound Data Navigator or the LDEO Long Island Sound Data Page.
Observations
Models
Technologies
Physical Oceanographic Observations
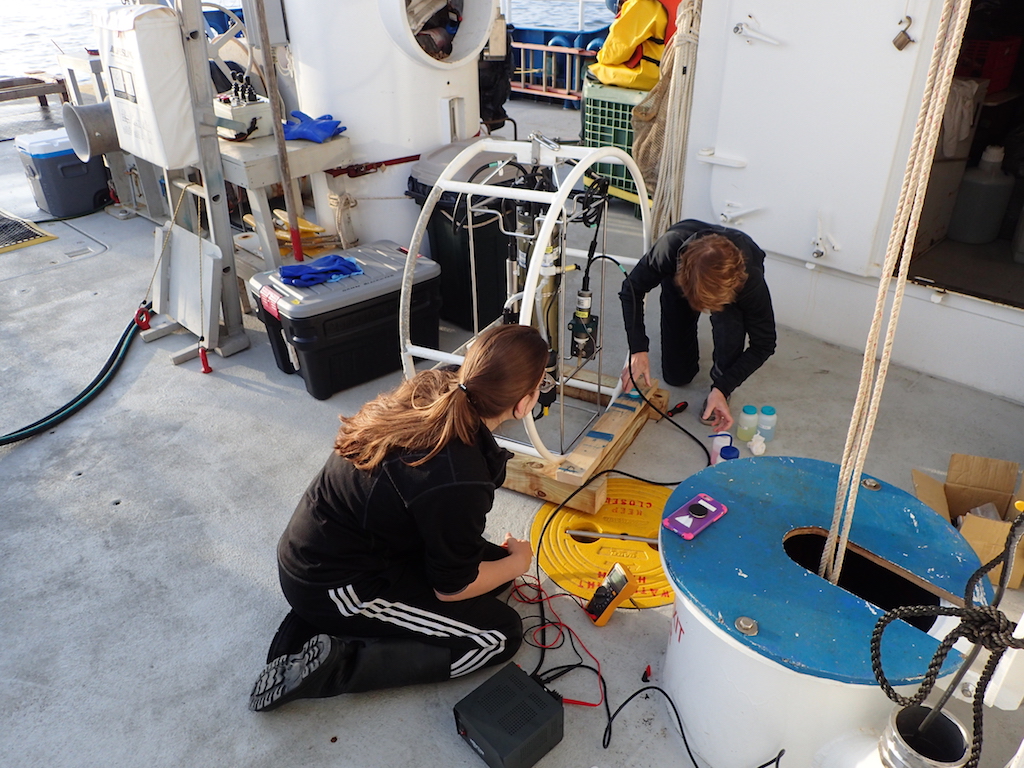
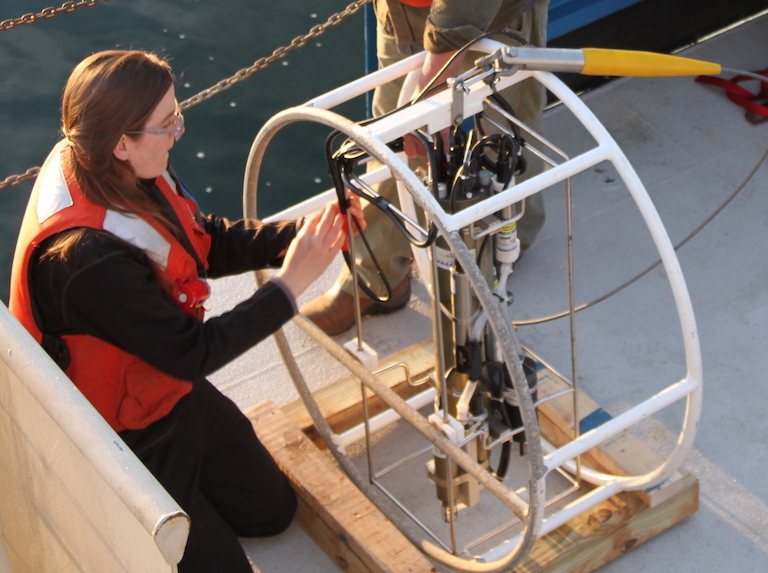
Direct observations (measurements) of a number of physical oceanographic parameters (temperature, salinity, bottom stress or currents) were made using a variety of instruments to capture both spatial and temporal variability. These observations were made from ship-based surveys to cover a wide area and from long-term (multiple week) seafloor observatories to cover longer periods of time. These instruments are described in the Technologies page.
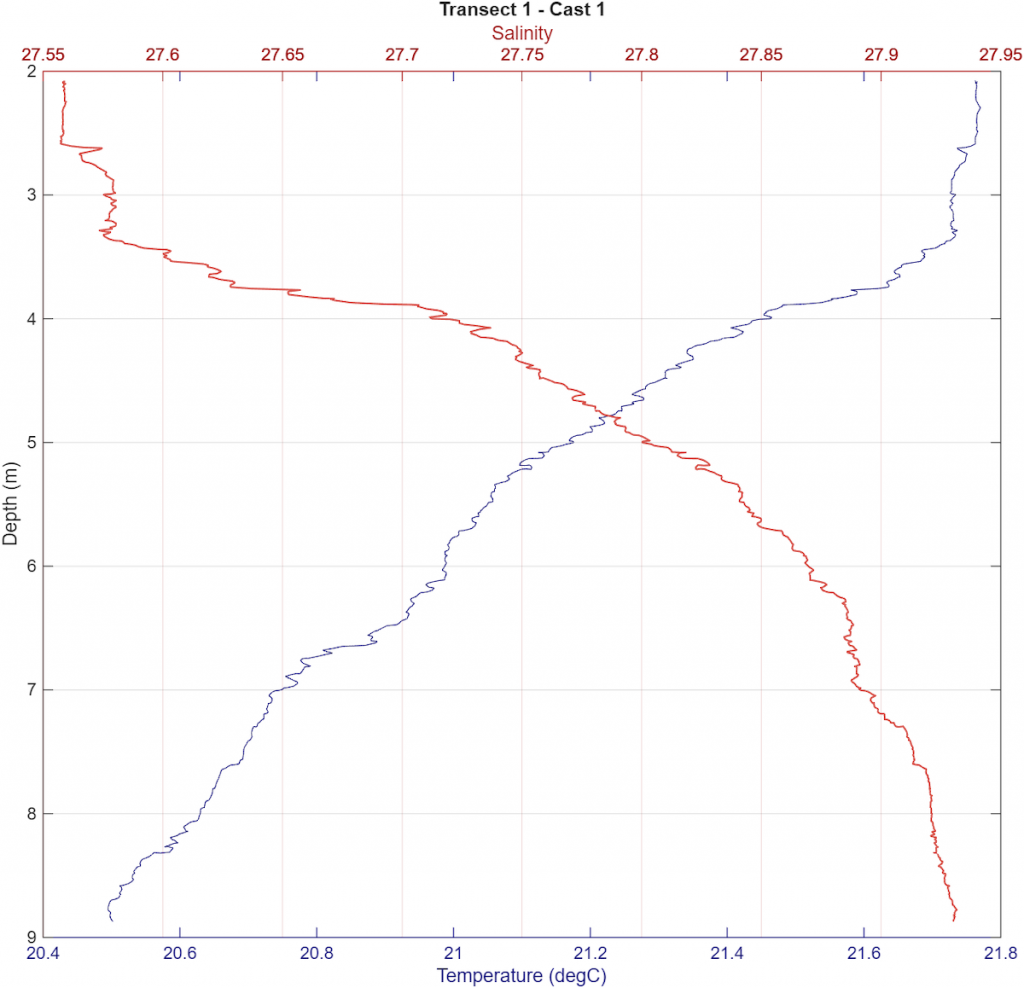
Ship-based Conductivity, Temperature & Depth (CTD) Profiles
The data were obtained during ship survey cruises using two instrument systems lowered over the side: a SeaBird Electronic SBE9plus or a SeaBird Electronics SBE19plus V2. These instruments were deployed at multiple points in a survey area over the course of a 12-hour sampling design. Seasonal surveys were also conducted to compare the range of variables. The map below shows the locations of the CTD casts conducted in 2017 and 2018 cruises from the RV Connecticut. Similar sampling protocols were also conducted in other parts of the Sound
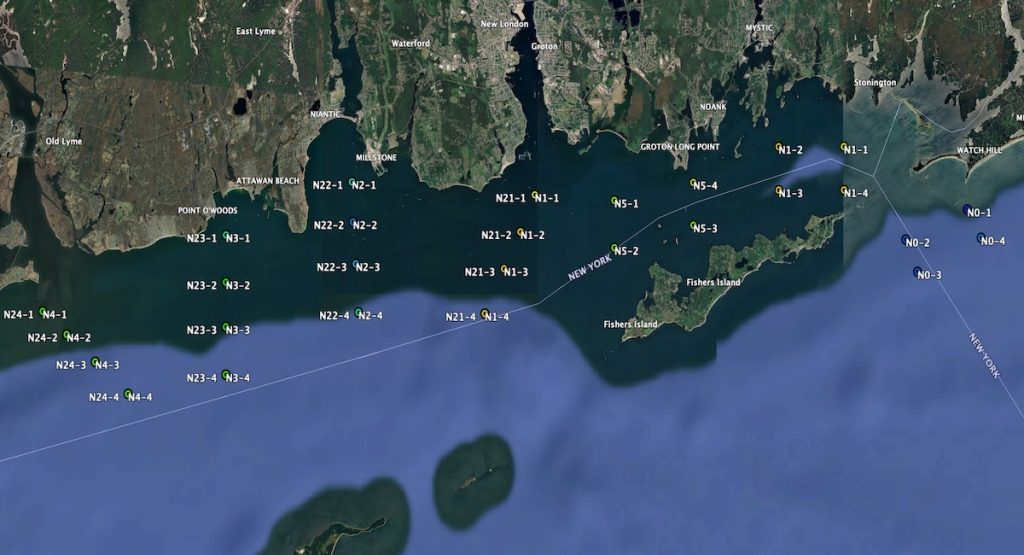
Ship-based CTD and ADCP observations
The map shows the location of ship-based observations conducted by the Research Vessel Connecticut. The points are locations where the conductivity, temperature and depth profiles were conducted. The ship’s acoustic doppler current profiler was operating continuously as the ship transited from one station to the next.
Bottom Frame Mounted CTD Records
In addition to the ship-based CTD sampling, a SeaBird Instruments SBE37 unit was mounted on a seafloor observatory to measure site-specific variability in the variables over a period of weeks to months. Three to five frames were typically deployed in the regions to provide regional variabilty in the measurements. The bottom frames also supported two acoustic doppler current profilers (ADCPs), one up-looking and another high resolution down-looking unit (see below).
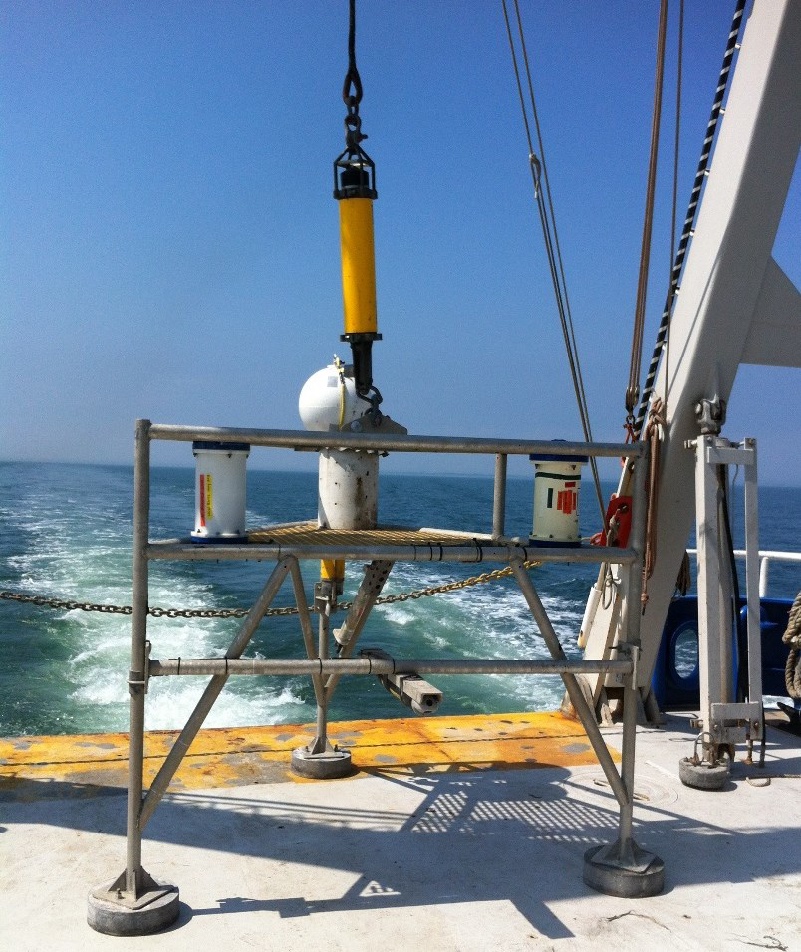
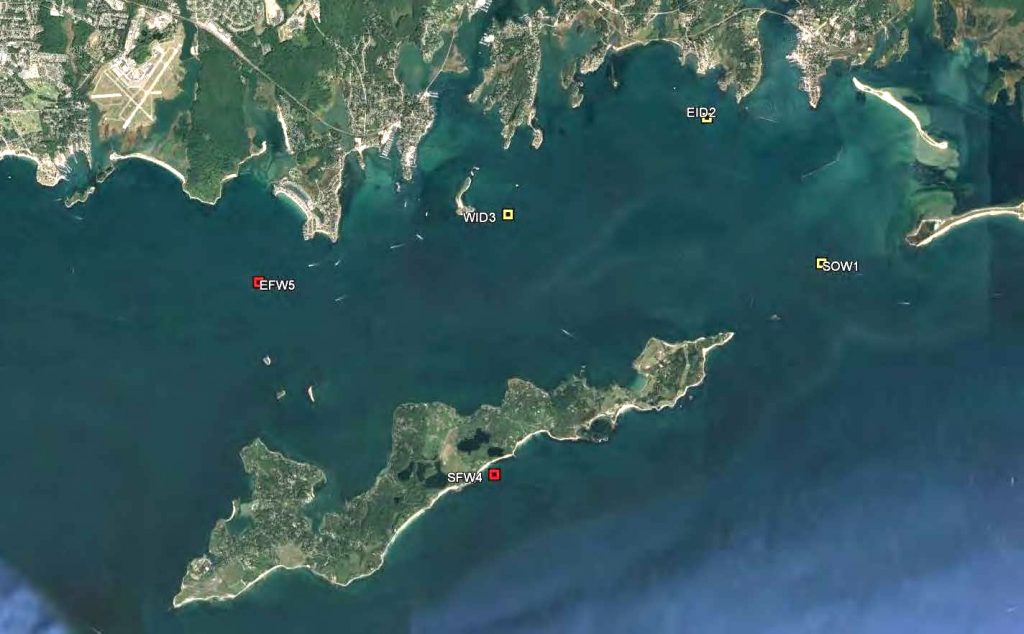
Acoustic Doppler Current Profiles (ADCP’s)
The circulation in the eastern part of Long Island Sound is highly variable in both space and time due to the complex bathymetry and coastal geometry. Since the water motion determines the shear stress on the sediments and benthos, the temperature and salinity, and the transport of material and organisms, it has a major impact on coastal ecology. The current data were obtained using two types of instruments deployed on the bottom of the Sound on a tripod frames, that again, were deployed in strategic locations in each region being studied. A high resolution (2 MHz) Nortek Aquadop was mounted 0.75 m above the seabed and oriented in a downward direction to measure the bottom stress in high resolution layers. A Teledyne RDI “Workhorse Sentinel” ADCP was positioned 1.5 m above the seafloor and oriented to profile towards the surface to measure the water currents flowing above the frame. The map shows the location of the five bottom frames that obtained data in spring and winter.
Physical Oceanographic Models
The Long Island Sound (LIS) FVCOM (Finite Volume Community Open Model) was initially developed with support from the Connecticut Sea Grant College Program. We developed an implementation of FVCOM (Chen et al., 2007) at UCONN and designed it to use the results of the operational northwest Atlantic regional model, operated as the Northeast Coastal Forecast System (NECOFS) to provide ocean boundary conditions. This ‘nesting’ approach is computationally efficient since it allows the effect of the larger-scale processes to be simulated at coarse resolution through NECOFS and allows UCONN computing resources to focus on the smaller-scale structures in LIS and Block Island Sound (BIS).
The model has been used to produce maps of of the key physical oceanographic parameters for each of the regions studied, these include:
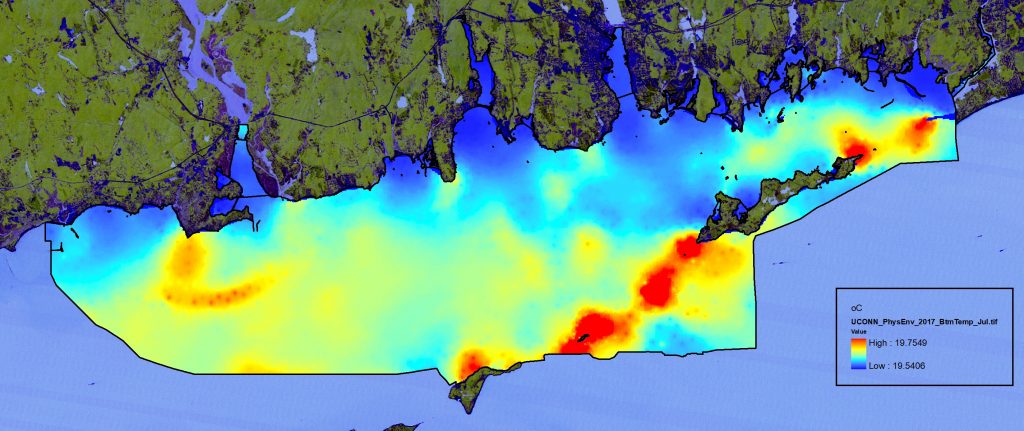
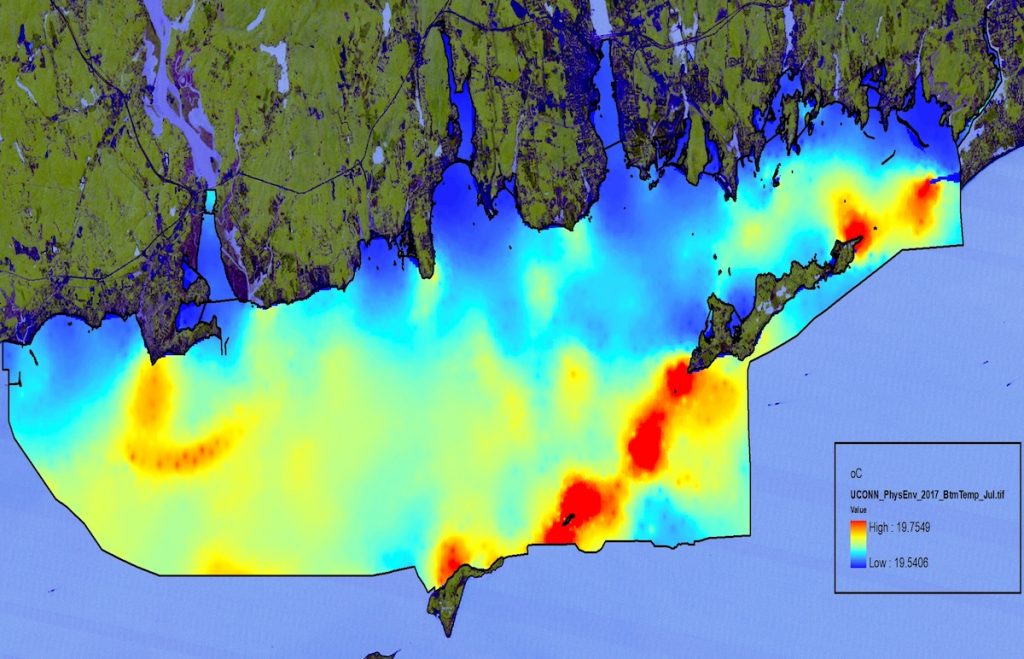
1. the bottom temperature distributions throughout the study area for each month
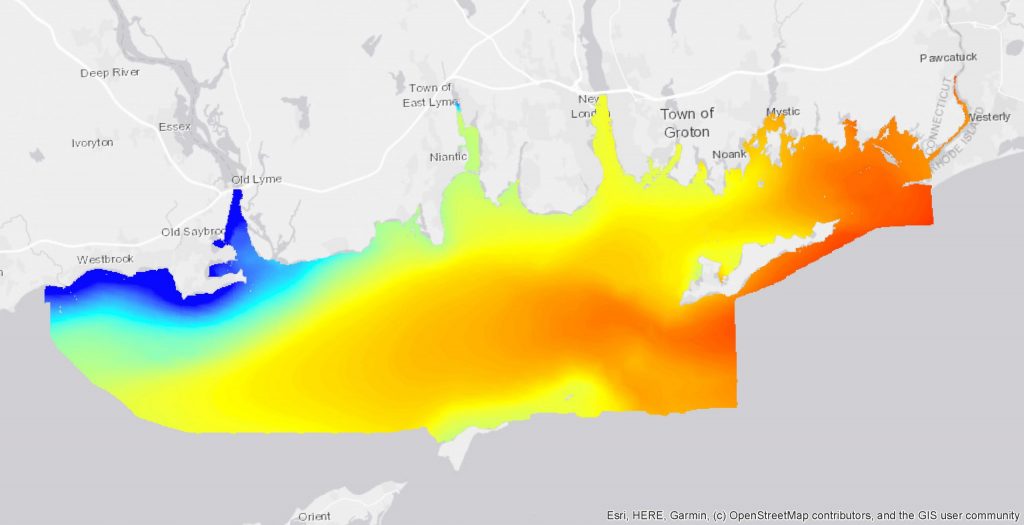
2. the bottom salinity distributions throughout the study area for each month (see the map on the right showing the salinity in April for eastern LIS)
3. the spatial structure of the maximum bottom stress magnitude due to (mainly) tidal currents
4. the spatial structure of the mean bottom stress magnitude due to (mainly) tidal currents
The figure below shows the model output for physical bottom stress, or the strength of currents in eastern LIS. As can be seen, the area called the Race between Long Island and Fishers Island, experiences very high bottom currents, as does the entrance to Fishers Island Sound to the east.